I’m sorry for not updating this blog more often but here a quick update to the previous EUR/USD chart.
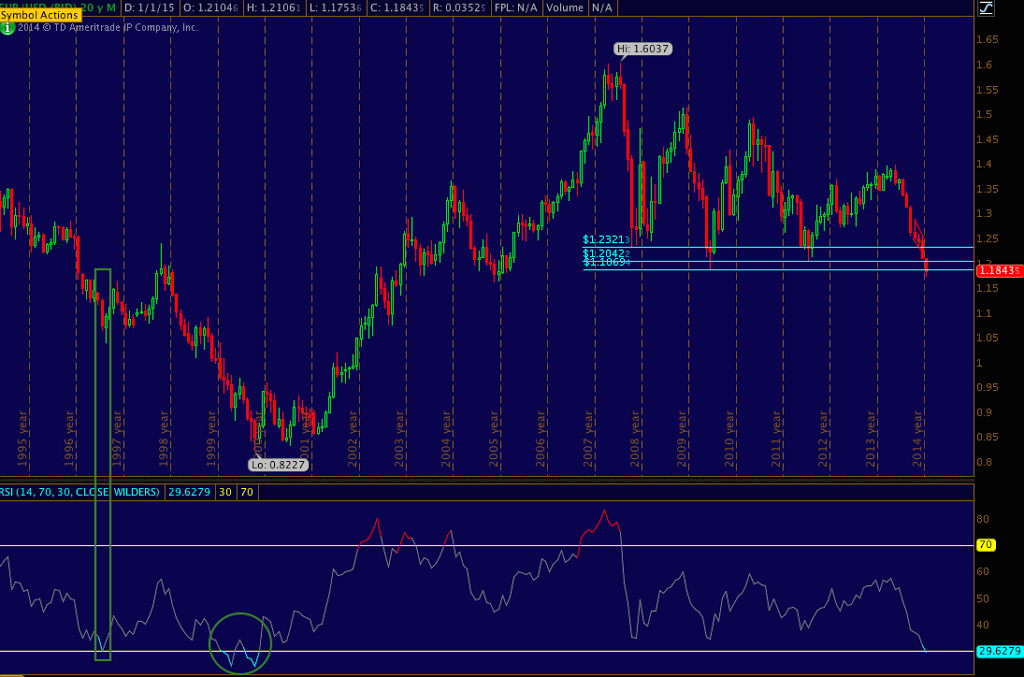
Below a monthly EUR/USD chart with a standard RSI applied. Note back in ~1996 when RSI touched the 30-level and rebounded.
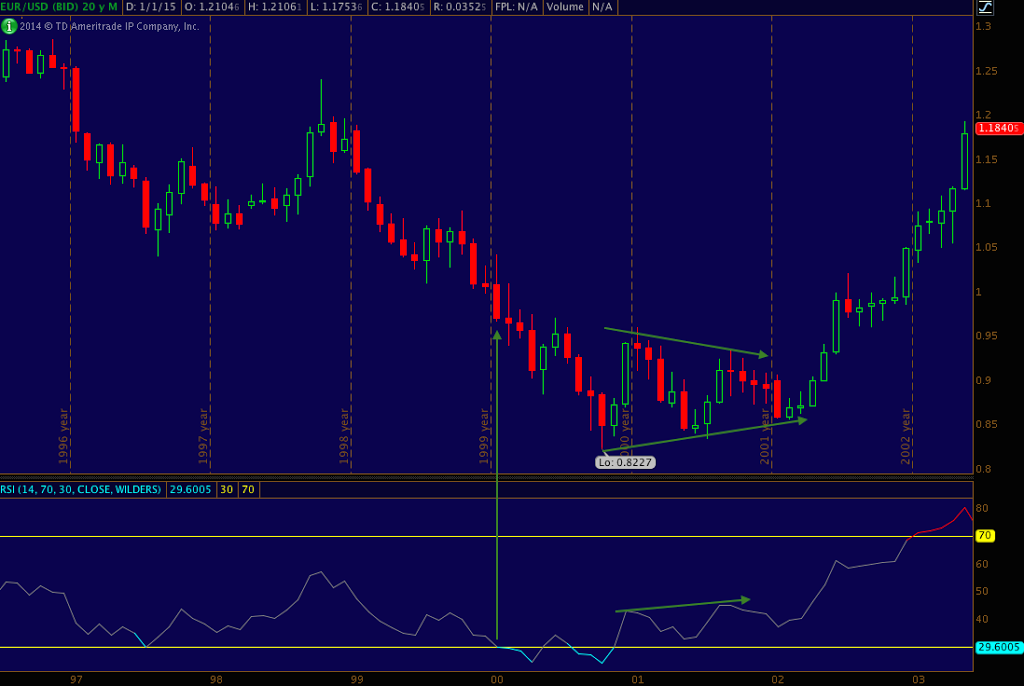
Below a close up of the same time frame; look at the same RSI 30 how much lower both the price and the indicator went back in 1999. Note also 2000 – 2001 positive divergence between the RSI and the EUR/USD price when finally EUR bottomed and made a nice rally that ended @ 1.60-ish.
Need to dig deeper, I’ll update more later..


