The rebound last week was expected, way higher than I had expected but nonetheless. The below graph illustrates the temperature of underlying instruments of the German DAX index. This is often called market breadth and the “tool” used is the McClellan Oscillator smoothed with EMA19 & EMA39.
The underlying seems more healthy now, only happy days ahead?
Interesting enough, look what happened last time (this summer) when the EMA19 passed -200 in the chart. DAX rebounded strongly but did not manage to put in a higher high but instead made a short term lower low.
The current situation is not a direct copy of what happened last time this summer but the pattern is a bit too similar..
 DAX underlying market breadth, McClellan Oscillator
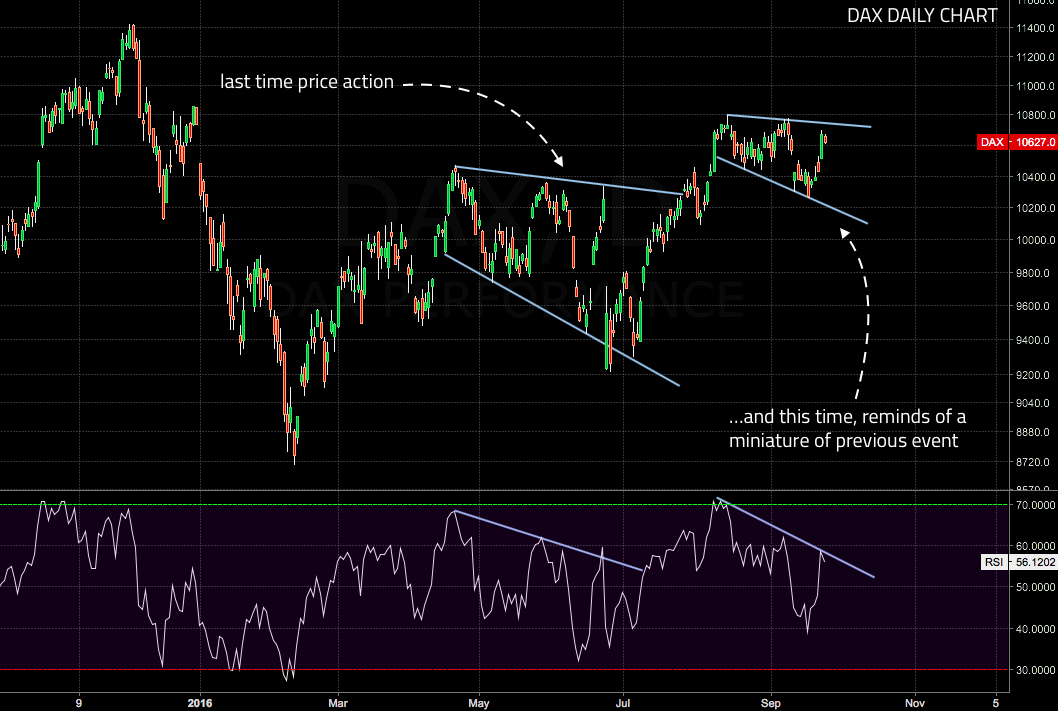
A zoomed in DAX daily chart where the previous event drawn into the picture. The current megaphone pattern is similar to past event, although in a smaller scale this time.

DAX underlying stocks (30 instruments) MA20 oscillator. Of 30 instruments, 22 (or 73%) is above its MA20 and 8 below MA20.

DAX underlying instruments, nr above its MA20 and below MA20
Disclosure: I’m in the bull camp until 10 500 is broken. Good luck, remember them stop’s!

