NOKIA WEEK 48
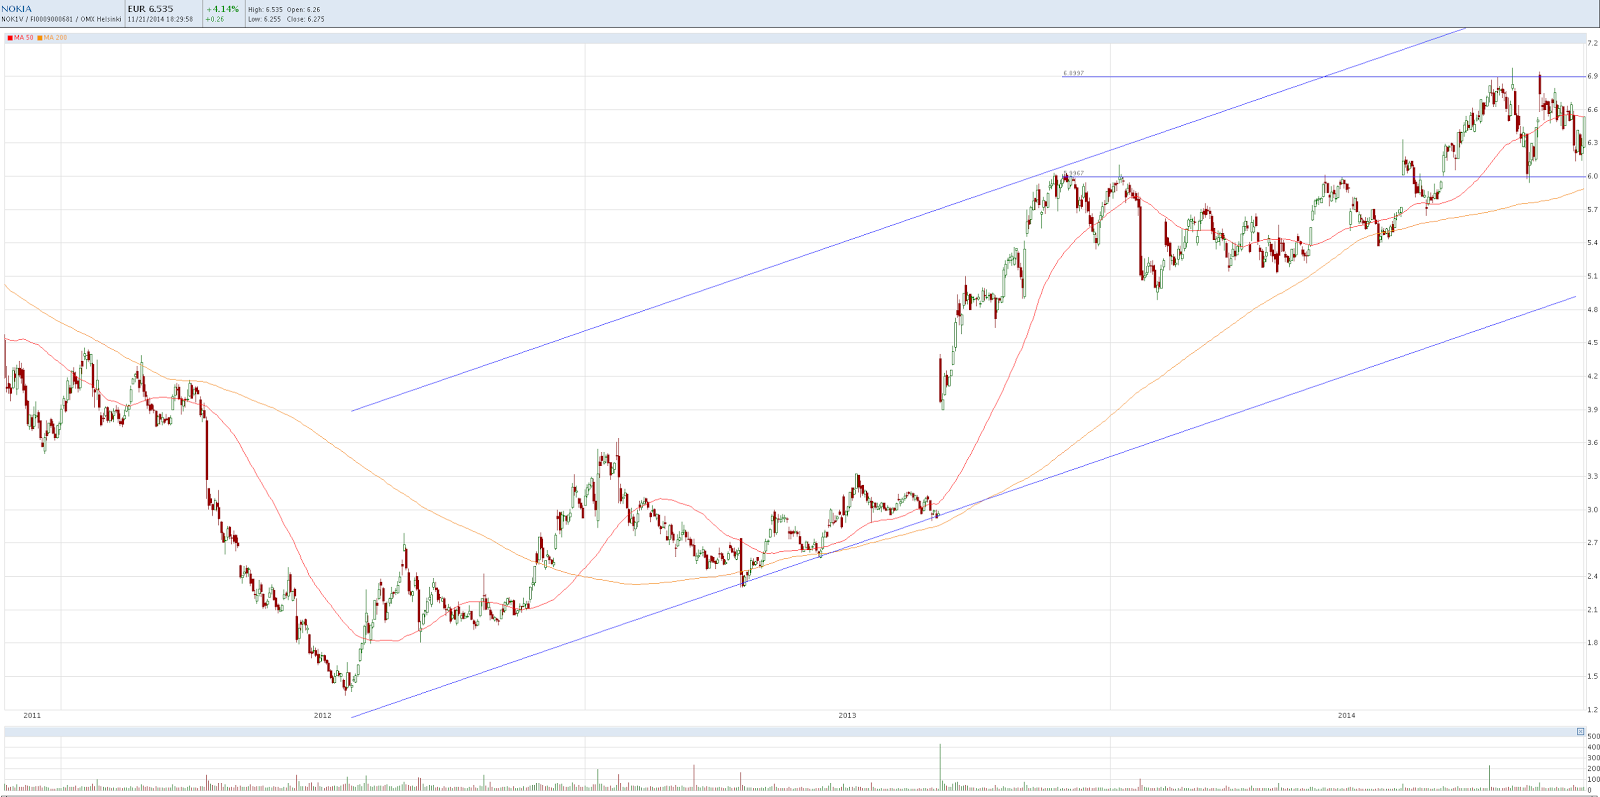
Nokia followed the rest of the markets last week and closed both the week and last friday in green. Nokia has been trading in a range between low 6 to high 6 euros over the last weeks. Close above EUR 7 opens mid 8 level prices. On the weekly chart, MA50 (currently just below EUR 6) is very important support. Also on the daily chart, MA200 is in the same area which makes it an even more important support level.

Nokia weekly chart
Nokia daily chart
Recent Posts