DAX managed to close last week in green once again. This was the 7th positive weekly close in a row. Although it is quite unusual to get this many green weekly closes in a row, it is not a new record. We do not have to go back further than 2015 when DAX put in 10 weekly green closes in a row before it pulled back ~-3%. Funnily enough, this was also close to a major market top. The saying what goes up.. seems to be true also for DAX occasionally.
The candlestick formation on the weekly chart below is also somewhat interesting. Week 2 candlestick reminds of a doji candlestick. Last week candlestick made a lower low and a lower high, although last week managed to close in green. What this means statistically, I do not know (don’t have any back testing stats on this yet). But I did not quickly manage to find similar price action in the close past; this pattern doesn’t happen too often (if someone has stats on this, drop me a line @twitter).

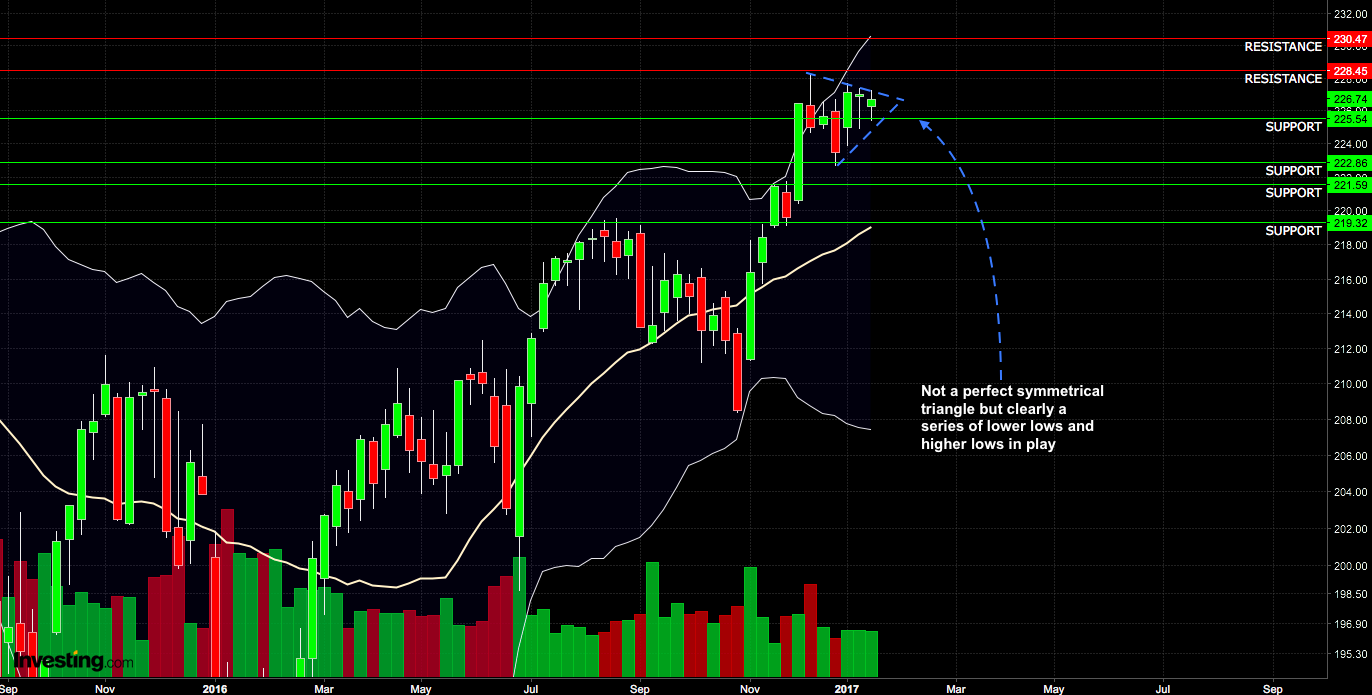
SPY closed the week ~-0,3 points lower than week 2. Below a weekly SPY chart where it is quite clear that the trend is upwards. We can also see a pattern that reminds of a symmetrical triangle, due to a series of higher lows and lower highs. In this case, the price action pattern is bullish.
On the daily charts for both DAX and SPY, there is no trend to talk about; MA20 is flat on both indexes. Also lower time frames (60min, 15min etc.) doesn’t give much clues will indexes break upwards, downwards or continue sideways. Best guess is that upcoming week will continue in a sideways trading range.

71% of stocks in SPX is above its MA50. $SPXA50R is close to crossing below MA10, which would be a bit bearish. Note also the negative divergence, that can continue for a long time before the markets pulls back.

$IWM trend is starting to turn around, being already below its MA20. MA20 is also trending slightly downwards. Also $RVX MA20 is pointing north, although big down day last Friday. 15-16 is support for $RVX.
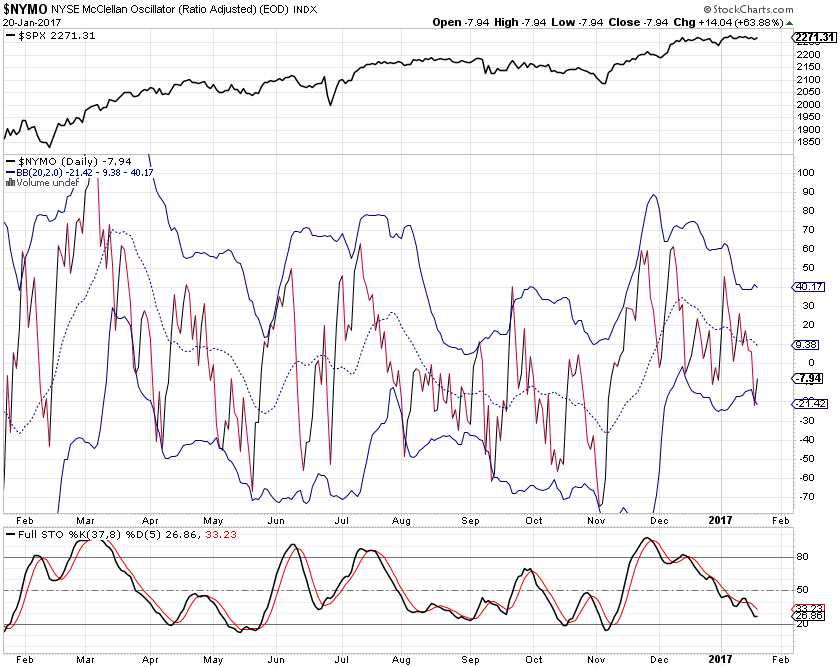
$NYMO MA20 trending downwards.

$TRIN below 1, strong breadth last Friday.

Possible double top on the SPX renko chart in play. I’d say the upside is limited based on this chart and probability for a pullback is getting quite high.

$NYSI crossed MA5, keep an eye on this index if it starts to trend down..

$VIX -9,7% last Friday. MA20 flat or slightly pointing north. Also $VIX close to the supportive 10 – 11 -level.

