
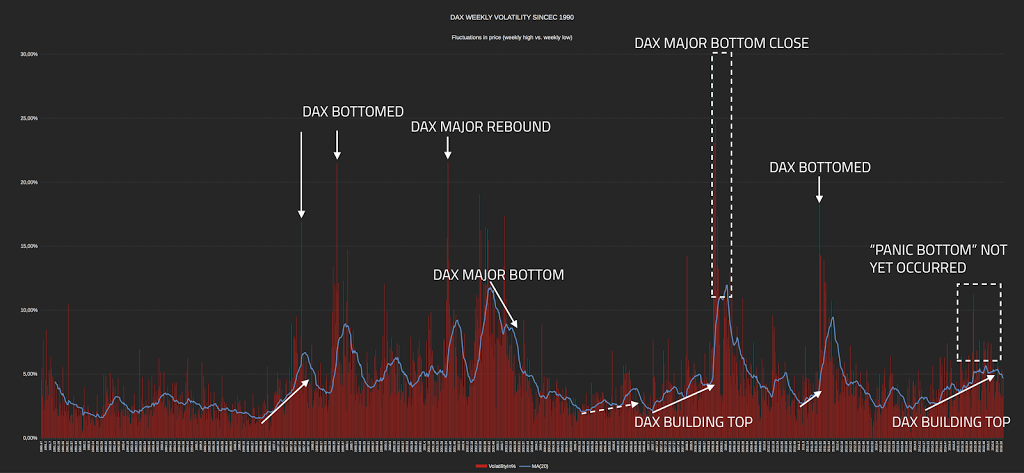
DAX – VOLATILITY SINCE YEAR 1990
DAX volatility since 1990 measured in weekly high vs. weekly low. Volatility (or price fluctuations) is a bad omen and more heads-up needed since top quite often building up.
The blue line represents Moving Average 20 (MA20) and could/should be lower (e.g. 10 weeks moving average) to better show divergences in tops & bottoms.
To cut a long story short, there has been no obvious “market panic” yet with volatility spiking through the roof. Will it be different this time..?
IMO, expect a panic move before the markets bottom out.
Recent Posts

