
BOTTOM SIGNALS
Long time no update and here comes a quick and dirty market update from my point of view.
The over all market trend is down, no doubt about that. However, there are several charts that are showing bottoming signals.. ..or very close to a bottom.
First off the bearish charts
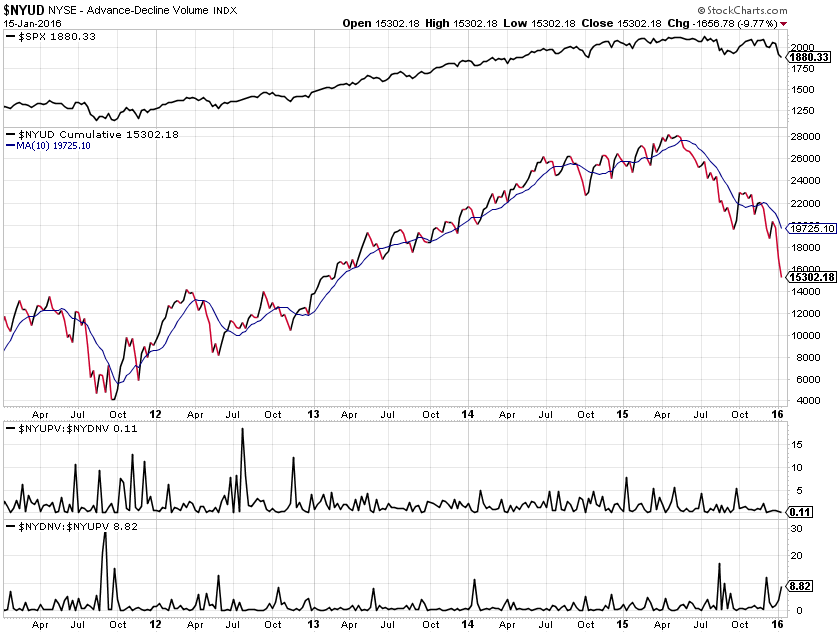
Cumulative weekly NYSE adv. decline, this is not looking good
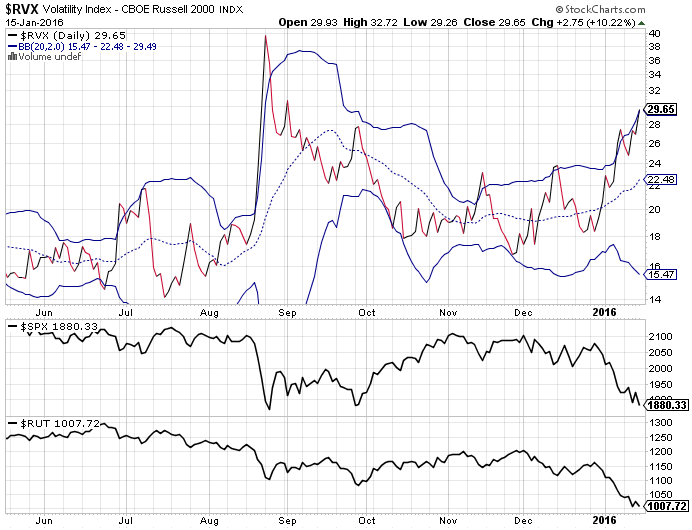
$RVX at critical levels for water fall market decline.
And then the charts that are showing bottoming signals.

NYSE adv. decl. issues with MA10 on weekly, getting quite low. We have seen significant rebounds from these levels in the past

NYSE McClellan with MA5, also this chart is showing low readings
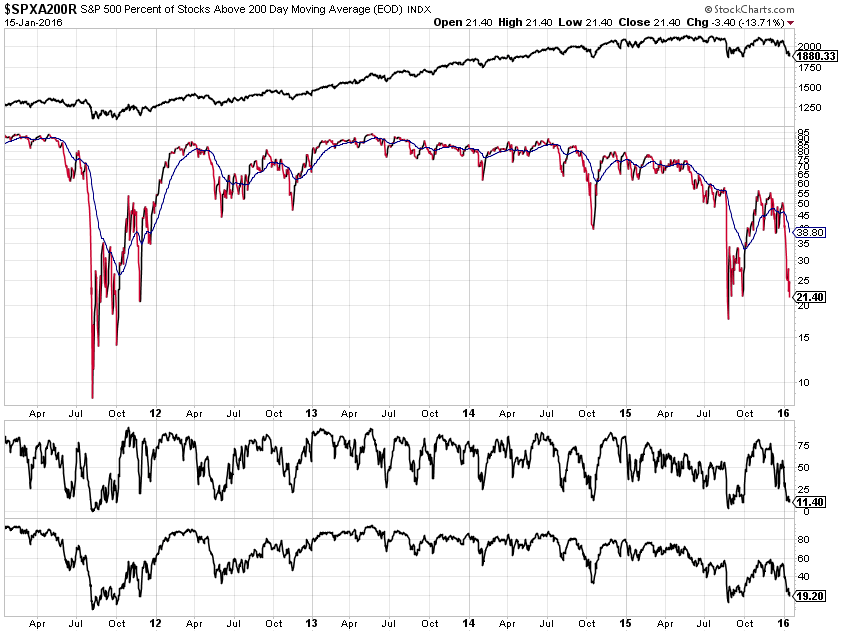
SP500 companies trading below MA200. Getting low but might get a panic sell wave still to get the bottom in.

NYSI McClellan weekly at very low readings. Historically rebound/bottom close when we have such low readings


