
DAX – ADVANCING VS. DECLINING STOCKS
Alright, the first chart contains some instructions or ideas how-to use the “market breadth” to your favour. Above the “market breadth indicator” (which is advancing stocks vs. declining stocks) is DAX daily close price plotted as an reference.
On the first chart I have plotted Moving Average 10 (MA10) to better show divergences, when the index movement is getting weaker. This technical indicator can be used in many ways, I’ll let you be the judge. Drop me a line @Twitter if you have any questions.

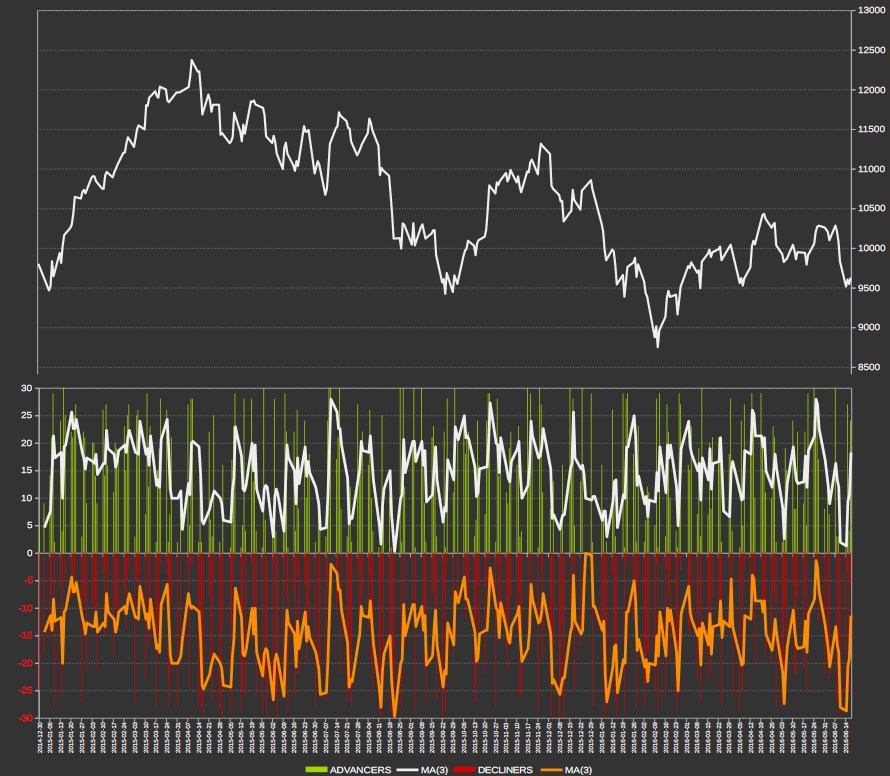
For shorter term traders, MA3 seems to work good for showing “extremes”
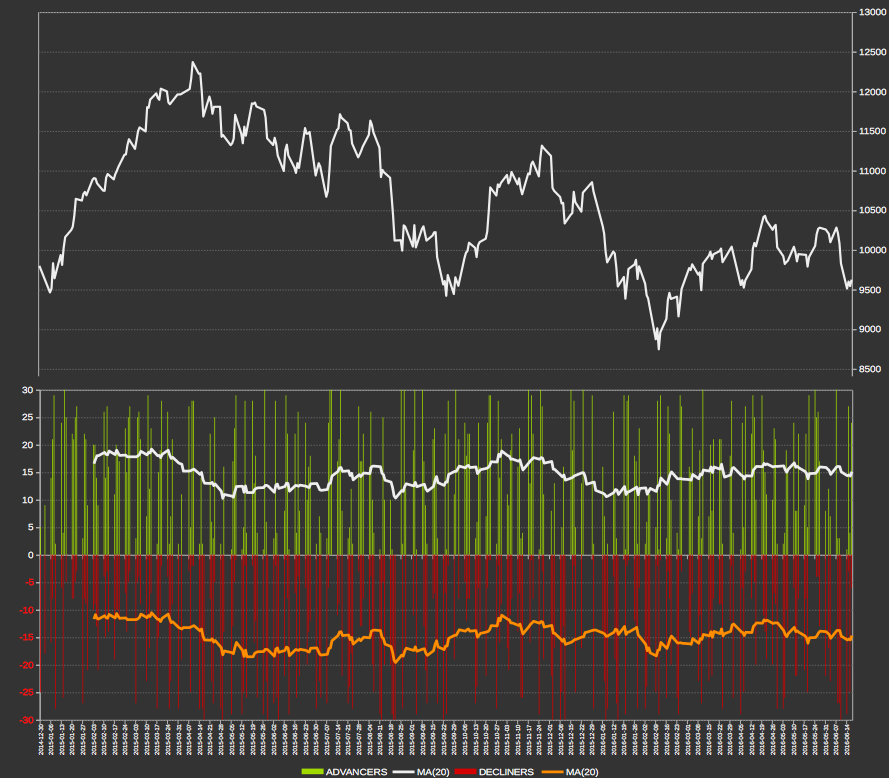
Longer averages doesn’t seem to be that useful but might be when looking at a longer time frame

MA(5) seems useful for swing traders. Please note though that there are some “false positives” if used as an reversal indicator!


